More Information
Submitted: October 17, 2024 | Approved: December 12, 2024 | Published: December 13, 2024
How to cite this article: Bagyalakshmi J, Kalaimani S, Sowmiyadevi B. Amine Functionalized Graphene Quantum Dots as a Smart Nano Antibacterial Agent. Heighpubs Otolaryngol Rhinol. 2024; 8(1): 004-013. Available from: https://dx.doi.org/10.29328/journal.hor.1001029.
DOI: 10.29328/journal.hor.1001029
Copyright License: © 2024 Bagyalakshmi J, et al. This is an open access article distributed under the Creative Commons Attribution License, which permits unrestricted use, distribution, and reproduction in any medium, provided the original work is properly cited.
Keywords: Quantum dot; Alternative antibiotic; Amine functionalization; ROS production
Amine Functionalized Graphene Quantum Dots as a Smart Nano Antibacterial Agent
Bagyalakshmi J*, Kalaimani S and Sowmiyadevi B
College of Pharmacy, Sri Ramakrishna Institute of Paramedical Sciences, Tamil Nadu, India
*Address for Correspondence: Bagyalakshmi J, College of Pharmacy, Sri Ramakrishna Institute of Paramedical Sciences, Tamil Nadu, India, Email: [email protected]
Conventional antibiotics are resisted by bacteria at an increasing rate, prompting studies into the development of alternate antibiotic agents. This work demonstrates the fabrication and characterization of amine functionalized graphene quantum dots (af-GQDs) with starting materials of graphene oxide, ammonia, and hydrogen peroxide by chemical oxidation and hydrothermal methods. The synthesized af-GQDs were characterized using analytical techniques such as UV-vis, fluorescence, FTIR, Raman spectroscopy, and morphological studies through TEM. TEM images showed that af-GQDs have smooth surface morphology with porous in nature and are spherical in shape with particle size less than 20 nm. The prepared af-GQDs show a quantum yield of 26.32%. A growth inhibition test was performed on E. coli and S. aureus for the prepared af-GQDs at different increasing concentrations. The minimum inhibitory concentration for the prepared af-GQDs on E. coli was found to be 55 μg/mL and for S. aureus was found to be 35 μg/mL. Percentage cell viability studies were performed on HeLa and Jukart cells for 24 hours at different concentrations. Both cells showed maximum cell viability percentage at the initial concentration. At higher concentrations, the cell viability is decreased for both cells but the Jukart cells show a minimum percentage of cell viability at higher concentrations than the HeLa cells.
A number of microbes are present in our surrounding environment such as soil, air, and water. Once a microbe or bacteria adheres to a surface, it leads to the formation of a complex bacterial community enriched with antibiotic-resistant bacteria known as biofilm [1]. Antibiotic resistance is becoming increasingly common around the world and threatening the well-being of humanity. In particular, β-lactam antibiotics are the most frequently prescribed antibiotic in hospital settings; however, bacteria are able to produce enzymes known as β-lactamases that result in bacterial resistance. Significant research has therefore been dedicated to developing alternate antibiotic agents that can overcome the bacteria’s resistance through unique bactericidal pathways. One such alternate route includes the use of graphene-based nano-materials capable of inhibiting bacterial growth through mechanisms such as physical adsorption and confinement, disruption of cellular processes, and membrane damage through physical and chemical interactions. Furthermore, some forms of functionalized graphene show semi-conductor characteristics making these materials light-sensitive and capable of photocatalyzing the formation of Reactive Oxygen Species (ROS), such as superoxide (O-), singlet oxygen (O*), hydroxy radical (*OH), and hydrogen peroxide (H2O2) that are known to be potent antimicrobial agents involving various destructive pathways, such as degradation of bacterial DNA and cell wall damage. It is inherently difficult for bacteria to overcome such destructive mechanisms of attack and therefore less likely for the bacteria to gain resistance against ROS-generating nano-materials [2].
Graphene derivatives represent a diverse class of carbon functional materials, including an exfoliated version of graphite called graphene, oxidised graphene called Graphene Oxide (GO), and a partially reduced form of GO called reduced Graphene Oxide (rGO). These materials have been shown to be effective antimicrobial agents on their own, and the antimicrobial activity can be further enhanced when combined with other materials to form a composite, notably with metal nanoparticles, metal oxide nanoparticles, and more recently with atomically dispersed metal atoms. By tailoring the synthesis methods of graphene-based materials, one can control the size, shape, and degree of oxidation to enhance water solubility, bacterial membrane contact, semiconductor properties, and other important properties for maximal antimicrobial performance.
Quantum dots as antibacterial agent
Quantum Dots (QDs) are a new type of fluorescent nanomaterial developed in recent years. Compared with traditional materials, QDs have unique physical and chemical properties, including high stability, an exceptionally narrow range of emissions, and high quantum yield. Thus, they are widely used in biosensors, real-time tracking, multi-colour labelling, and imaging. Currently, functionalized QDs attract much attention because of their exceptional antibacterial mechanisms, indicating that QDs could be applied in antibacterial research as an effective alternative to traditional antibiotic drugs. To increase their antibacterial efficiency, QDs are always functionalized using polymers and photosensitizers to induce more ROS and improve their attachment to bacterial components. The effectiveness of the inhibition action differs in functionalized QDs based on their ligand, size, shape, zeta potential, and charge transfer effect [3].
The term “smart” in the context of “Amine functionalized Graphene Quantum Dots (GQDs) as a smart nano antibacterial agent” can be justified based on the following key attributes:
Target-specific activity
Amine-functionalized GQDs often exhibit selective antibacterial activity against specific bacterial strains, such as Gram-positive or Gram-negative bacteria, due to their surface chemistry. This specificity can reduce off-target effects and enhance antibacterial efficiency, reflecting “smart” behaviour.
Stimuli-responsive behavior
These functionalized GQDs may exhibit enhanced antibacterial effects under certain conditions, such as changes in pH, temperature, or the presence of bacterial enzymes. Such responsiveness makes them adaptive to the local microenvironment, qualifying them as “smart” agents [4].
Multifunctionality
The “smart” nature also stems from its ability to serve multiple roles simultaneously, such as penetrating bacterial cell walls, generating Reactive Oxygen Species (ROS), and disrupting cellular components through electrostatic interactions.
Reduced resistance development
Traditional antibiotics often lead to bacterial resistance over time. Amine-functionalized GQDs can bypass conventional resistance mechanisms by physically disrupting membranes or other bacterial structures, demonstrating a “smart” alternative approach.
Biocompatibility and low cytotoxicity
Their amine-functionalization enhances biocompatibility while maintaining potent antibacterial effects. This balance of efficacy and safety aligns with the concept of “smart” design.
Sustainable and controlled release
If these agents are designed to release their antibacterial components in a controlled manner, it reduces the risk of overdose or unintended harm to beneficial microbes, embodying a “smart” and sustainable solution. In summary, the term “smart” reflects the advanced and adaptable properties of amine-functionalized GQDs, such as specificity, multifunctionality, and responsiveness, which go beyond conventional antibacterial agents.
Limitations of quantum dots [5]
1. Toxicity concerns: Amine Functionalization and Cytotoxicity: While amine groups generally improve the biocompatibility of GQDs, they can also introduce cytotoxicity under certain conditions. The nature of the amine group (e.g., primary, secondary, or tertiary amines) can impact the toxicity profile. Excessive surface amination may lead to increased cellular uptake, which can cause cellular stress, oxidative damage, or inflammation, potentially limiting their biomedical applications.
Long-term effects: The long-term effects of amine-functionalized GQDs in biological systems are still under investigation. Accumulation in tissues or organs, and their eventual degradation products, may pose risks to health, and this could be exacerbated by the amine groups.
2. Surface chemistry and stability issues: Surface Passivation and Instability: Amines are reactive groups that can undergo protonation, oxidation, or interaction with other environmental factors (e.g., air or water). This can lead to the loss of functional groups or changes in the surface charge, which in turn might reduce the stability of the amine-GQDs. Over time, these changes could lead to aggregation or precipitation of the particles, reducing their effectiveness in applications like drug delivery or biosensing.
Surface saturation: The number of amine groups that can be successfully attached to the GQD surface is limited. Once the surface is saturated, further functionalization may be difficult, limiting the versatility of amine-functionalized GQDs.
3. Reduced photophysical properties: Quenching of Luminescence: Amine groups can sometimes interfere with the photophysical properties of GQDs. Amine functionalization might cause quenching of the quantum dot’s fluorescence due to charge transfer between the amine groups and the graphene core or through non-radiative recombination processes. This can reduce their effectiveness in optoelectronic applications, including sensors, imaging, and biosensing.
Fluorescence stability: The photostability of amine-functionalized GQDs can be compromised, especially under prolonged exposure to light or in the presence of oxygen and moisture. This affects their use in long-term monitoring or imaging applications.
4. Aggregation and dispersion problems: Poor Dispersion in Non-Aqueous Solvents: While amine groups improve the solubility of GQDs in aqueous media, they may not significantly enhance dispersion in organic solvents or other non-aqueous environments. This could limit their use in a broader range of applications, such as organic electronics or composite materials.
Aggregation in solution: Amine-GQDs may exhibit aggregation behavior in certain solutions, particularly when exposed to higher concentrations of salts or in the presence of certain ions. Aggregation could significantly impact their performance in drug delivery systems, imaging, and sensing, where uniform dispersion and surface interactions are critical.
5. Interference with biological systems: Interaction with Proteins and Biomolecules: The amine groups on the surface of GQDs may interact with biomolecules such as proteins, nucleic acids, or other cellular components in ways that alter the biological behavior of the system. These interactions can lead to non-specific binding or interference with biological processes, which is undesirable in applications like biosensing, bioimaging, or drug delivery.
Immune response: The surface characteristics of amine-functionalized GQDs can trigger an immune response, potentially leading to inflammation or the activation of immune cells. This is a significant concern for in vivo applications and could limit their use in clinical or therapeutic settings.
6. Cost and complexity of synthesis: Complicated Functionalization Procedures: The synthesis of amine-functionalized GQDs often requires multiple steps and specific conditions to ensure that the amine groups are properly attached and the quantum dots remain stable. This complexity can lead to higher costs and more difficult scaling up of the process for industrial applications.
Control of functionalization: Achieving a high degree of functionalization with amine groups while maintaining consistent size, shape, and uniformity of the GQDs is a challenge. Variability in surface modification can result in inconsistent properties, reducing the reproducibility of results, especially in research and commercial applications.
7. Limited control over surface properties: Heterogeneity: The amine groups introduced onto the surface of GQDs can cause variability in the surface chemistry, leading to heterogeneous properties of the particles. This heterogeneity can affect the uniformity of the GQD properties (e.g., fluorescence intensity, surface charge, or interaction with other materials), making them less ideal for high-precision applications.
Surface charge: Amine functionalization generally introduces positive charges to the surface of GQDs, which can lead to changes in their behavior in biological systems, especially in terms of cellular uptake and tissue distribution. The surface charge could also affect their interactions with other charged species, such as proteins, ions, or drugs, which may not be ideal in all applications.
1. Degradation and environmental impact: Degradation Over Time: Amine-functionalized GQDs may degrade over time due to environmental factors like light, air, moisture, or temperature. The stability of the amine groups and the GQD structure is crucial for their long-term application, and degradation can lead to a loss of desired properties (e.g., fluorescence or solubility).
Environmental persistence: The environmental persistence of amine-functionalized GQDs is not fully understood. The amine groups, along with the graphene core, could remain in ecosystems for long periods if they are released into the environment, leading to potential long-term ecological consequences.
2. Limited biocompatibility for in vivo applications: Blood-Brain Barrier (BBB) Penetration: While amine functionalization can improve the water solubility and biocompatibility of GQDs, this may not be sufficient for applications requiring efficient tissue penetration, such as drug delivery or medical imaging. The surface charge and size of amine-GQDs can impact their ability to cross biological barriers like the blood-brain barrier.
Long-term biocompatibility: For in vivo applications, the long-term effects of amine-GQDs, including accumulation, clearance, and potential toxicity, need to be carefully assessed. The surface amine groups may influence these aspects in ways that require further investigation.
The aim and objective of this study are:
To synthesize carbon-based antibiotic alternatives for effective treatment against microorganisms
To prevent the side effects of antibiotics using Graphene Quantum Dots as an antibiotic alternative
To fabricate Graphene Quantum Dots by Hydrothermal method To functionalist the Graphene Quantum Dot
To evaluate the antibacterial activity of synthesised Amine functionalized Graphene Quantum Dots
To perform cytotoxicity study of Amine functionalized Graphene Quantum Dot [6].
Materials required
Graphene oxide, Sulphuric acid, Potassium permanganate, Hydrogen peroxide, Ammonia
Pre - formulation studies
Physical characteristics: By visual examination, the Graphene Oxide was tested for its physical characteristics like colour, odour, and texture [7].
Solubility test: Graphene Oxide (about 1mg) was taken in a test tube and solubility in ethanol, water, dichloromethane, and chloroform was tested [8].
Synthesis of graphene quantum dots by chemical oxidation method
Graphene oxide (1 g) was suspended in concentrated sulphuric acid for about 2 h. followed by the addition of 40% weight of potassium permanganate powder. The acidic and oxidizing conditions provided shear-influenced exfoliation of the graphene oxide. This reaction solution was left under stirring conditions for 2 hours at room temperature. Next, the solution was heated for about 1 h at 45 °C. During this heating step, 40 mL of deionized water was added. resulting in effervescence. After 30 minutes, the temperature of the reaction mixture rose to bout 80°C. A small volume of 30% hydrogen peroxide was then added to ensure complete consumption of potassium permanganate powder. The reaction was then quenched by pouring the reaction mixture over ice. The obtained solution (around 70 mL) was subjected to ultra-sonication for 5-6 min. This solution was separated from the large particles of graphene by filtration through a microporous membrane. Dialysis of the supernatant with the aid of a 3 kDa membrane allowed the attainment of green graphene quantum dots [9].
Amine functionalization of prepared graphene quantum dots
About 10 ml of prepared Graphene quantum dot solution was mixed with 5 ml of Ammonia and 1 ml of Hydrogen peroxide, the mixture was then sealed in Teflon lined container and placed in a stainless steel autoclave reactor for 3 hours at 150°C then it was allowed to cool at room temperature then the resulting liquid is dialysed for 3 days against deionised water and passed through PTFE syringe filter of 0.25 μm diameter to get green fluorescent amine functionalized graphene quantum dots [10].
Characterization of graphene quantum dots
Zeta potential and particle size characterization: The size and morphology of amine-functionalized GODs were investigated using a Malvern zetasizer and transmission electron microscopy respectively. The samples were immobilized in the carbon/form at coated copper grids. They were dried at room temperature and were examined using a TEM without being stained. The crystalline phase is investigated by a Malvern analytical multipurpose diffractometer [11].
Quantum yield calculation
The quantum yield (QY) of the prepared amine functionalized GODs is obtained according to an established spectrofluorimetric method. Quinine sulfate is dissolved in 0.1 M H2SO4 (F= 54%) as a standard. Both the absorbance of amine-functionalised GQDs and quinine sulfate solutions were adjusted to below 0.1 to minimize the inner filter. The quantum yield of amine-functionalised GQDs is determined by the following Equation [12]:
QYx = QYst (Ix/Ist) (Ast/Ax) (nx/nst)
Where, I- the fluorescence integral intensity A- Absorbance, n- refractive index.
The subscripts X and st correspond to amine-functionalised GODs and quinine sulfate.
Spectrofluorimetry
Fluorescence spectroscopy of amine-functionalised GQDs is performed with a Horiba Fluoromax4 spectrophotometer it has different excitation wavelengths ranging from 250 to 480 mm. UV absorption spectra were obtained using a Shimadzu probe 2.0 UV spectrophotometer [13].
Fourier transform infrared spectroscopy
FTIR studies were carried out to study the presence of functional groups on the synthesized amine functionalized GQDs. The Fourier transform infrared (FTIR) spectra of synthesized amine functionalized GQDs were measured by a Thermoshimadzu FTIR spectrometer with the KBr pellet technique ranging from 400 to 4000 cm-1 [14].
Raman spectroscopy
Raman spectroscopy is a vital technique to assess the quality of synthesized amine functionalized GODs. The D and G band features reveal important information about the successful formation of the desired quantum dots. These bands are associated with disorder and defects in the hexagonal lattice (D band) and sp2 carbon atom vibrations (G band). The ratio of the intensity of these bands (ID/ 1G ratio) is used to express the extent of sp2/sp3 hybridization of carbon atoms. The Raman spectrum of as-prepared amine functionalized GQDs was recorded at ambient temperature using Fluorescence microscopy, images were captured using a Confocal Raman Microscope with AFM (atomic force microscopy) imaging fluorescence microscope at an excitation wavelength of 50 cm’ – 4000 cm’ [15].
Evaluating antibacterial activity of amine functionalized graphene quantum dot
Microdilution experiments: Minimum Inhibitory Concentration (MIC) is the lowest concentration of a chemical to inhibit the visible growth of a bacteria species. The chemical solution was prepared in vitro at various concentrations with separated batches. The same amount of target bacteria species was incubated with the batches for more than 10 hours. Optical transparency for the batch solution indicates the inhibitory ability of the chemical to the bacteria [16].
MTS cell viability test
Cell viability assays were assessed in Jurkat and HeLa cells for Amine functionalized GQDs at the concentrations (20, 40, 100, and 200 μg/mL) using the (MTS) CellTiter 96® Aqueous Solution Cell proliferation Assay. For HeLa, 2×10⁴ cells were seeded in 96-well plates and for Jurkat 2×10⁵ cells were seeded in 96-well plates and grown overnight. Fresh culture medium was used as a negative control. After 24 h of cell incubation, the medium was discarded and 100 L of fresh cell medium with 20 L of MTS reagent was added. Then, the cells were incubated for 30 min at 37◦ C and centrifuged at 1400 rpm for 5 min. Subsequently, the cell medium containing the MTS reagent was transferred to a new microplate, and the absorbance at 490 nm was measured with a UV–vis microplate spectrometer. For data analysis, the results were expressed as % of cell viability. The equation used was the following [17]:
Pre-formulation studies
Physical characteristics: Graphene oxide was checked for its colour, odour, and texture. Graphene oxide is a dark black coloured powder in appearance, odourless and amorphous in nature [7].
Solubility: Solubility test for graphene oxide was carried out in different solvents such as ethanol, water, dichloromethane, and chloroform and results are given in Table 1 [8].
| Table 1: Solubility of graphene oxide in different solvents. | ||||
| SI. NO | Solvent | Soluble | Sparingly soluble | Insoluble |
| 1 | Water | _ | _ | |
| 2 | N-methyl-2- pyrrolidone | _ | _ | |
| 3 | Ethylene glycol | _ | _ | |
| 4 | Ethanol | _ | _ | |
Synthesis of GQDs
The GQDs have been prepared by chemical oxidation method from thermally exfoliated graphene oxide by treatment with sulphuric acid. The prolonged acidic treatment and long-time sonication showed a positive effect in increasing the amount of acidic groups on the graphene surface. Strong oxidation treatment greatly enhances the dispersion stability of the synthesized GQD in water and improved hydrophilicity renders these nanomaterials less reactive in the biological systems [18,19].
Fl formulation of GQD prepared by chemical oxidation method using less quantity of graphene oxide and with less sonication time (15 min) and centrifugation speed (5000 rpm) (Table 2). FI showed very light green fluorescence under UV light at 365 mm. From the information obtained in the F1 formulation, F2 attempted to increase the graphene source and double the sonication time (15-30 min) and obtained bright green fluorescence as compared to FI. This may be due to the formation of nano-sized carbon particles with increased sonication time. But in the F2 formulation excitation and emission peak were not obtained. So F3 formulation was attempted with increased sonication time (1 hr) and graphene source (0.5g). Bright green fluorescence was obtained under UV light at 365 nm. In the F3 formulation, the excitation peak was observed at 216 nm, but the emission peak was not properly obtained and the average particle size in particle size analysis was found to be 2541 nm. Then F4 formulation was attempted by increasing sonication time (2 hr) and centrifugation speed at 10000 rpm to get low-sized nanoparticles like dots and the average particle size obtained for F4 formulation was found to be 590 nm. This study focused on preparing GOD at less than < 20 nm and again F5 formulation prepared with increased sonication time (3 hr) and centrifugation speed at 12000 rpm. The average particle size by particle size analysis for F5 was found to be 48.5 nm. As the size obtained was not less than < 20 nm, the F6 formulation was attempted with increased sonication time (4 hr) with the same centrifugation speed, and the sample was analysed by TEM, and the average particle size of the formulation F6 was found to be 15.21 nm. Even though green fluorescence is observed in the UV chamber at 365 nm for all formulations, F1 showed less fluorescence compared to other formulations, and prominent excitation and emission peaks were observed in F4, F5, and F6. This may be due to an increase in sonication time and centrifugation speed. This increased sonication time might produce nano-sized particles like dots and separation of such nanoparticles is possible only with high centrifugation speed (12000 rpm) and the quantum confinement effect that is photoluminescence varies with nanoparticle sizes. The photoluminescent green graphene quantum dots prepared by the chemical oxidation method required a particular concentration of graphene source (GO), increased sonication time, and centrifugation speed.
| Table 2: Different formulations prepared by the chemical oxidation method. | ||||||
| Materials | F1 | F2 | F3 | F4 | F5 | F6 |
| Graphene Oxide (g) | 0.05 | 0.2 | 0.5 | 0.8 | 1 | 1 |
| Potassium permanganate (g) | 4 | 4 | 4 | 4 | 4 | 4 |
| Sulphuric acid (ml) | 10 | 10 | 10 | 15 | 15 | 15 |
| Sonication time (min) | 15 | 30 | 1 | 2 | 3 | 4 |
| Centrifugation Speed (rpm) | 5000 | 5000 | 5000 | 10000 | 12000 | 12000 |
Amine functionalization of prepared graphene quantum dots
Amine functionalization of prepared graphene quantum dots by hydrothermal cutting. About 10 ml of the prepared Graphene quantum dot solution of formulation F6 was mixed with 5 ml of Ammonia and 1 ml of Hydrogen peroxide, the mixture was then sealed in a Teflon-lined container and placed in a stainless steel autoclave reactor for 3 hours at 150 °C
the mixture was then allowed to cool at room temperature, the resulting liquid was dialysed for 3 days against deionised water and passed through PTFE syringe filter of 0.25 μm diameter to get green fluorescent amine functionalized graphene quantum dots [20].
Characterisation of GQDs
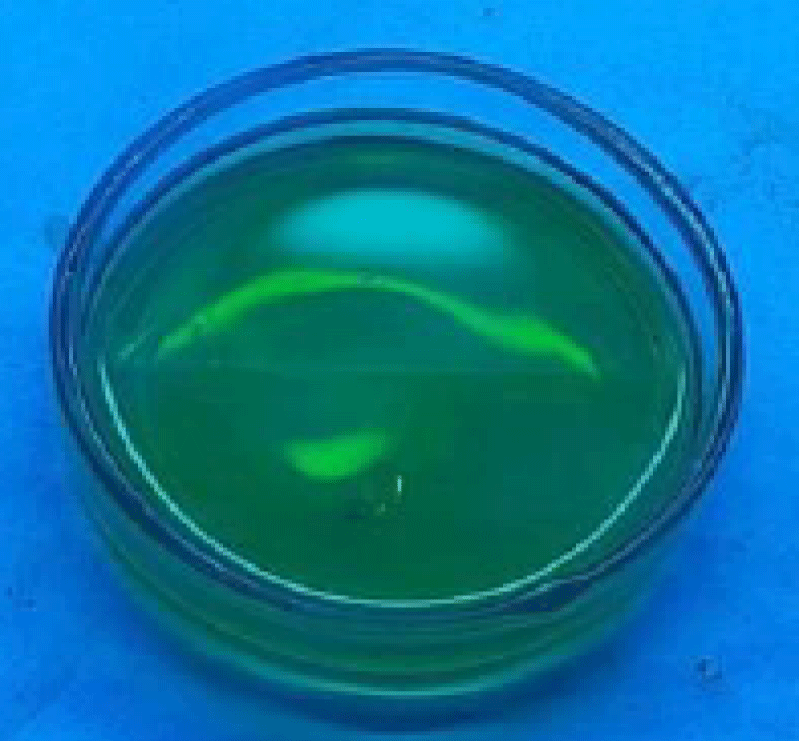
UV spectra analysis and photoluminescence: The optical properties of prepared GQD were evaluated by UV and Photoluminescence (PL) analysis. The GQDs prepared in this study also showed excitation-dependent photoluminescence. Photoluminescence (PL) is due to surface energy traps and quantum effects. Under normal light conditions, the GQDs solution in the water had a yellow-pale orange colour and GQDs emitted green fluorescence under UV light at 365 mm as shown in Figure 1 [21].
Figure 1: GQDs exhibit green fluorescence under UV radiation at 365 nm.
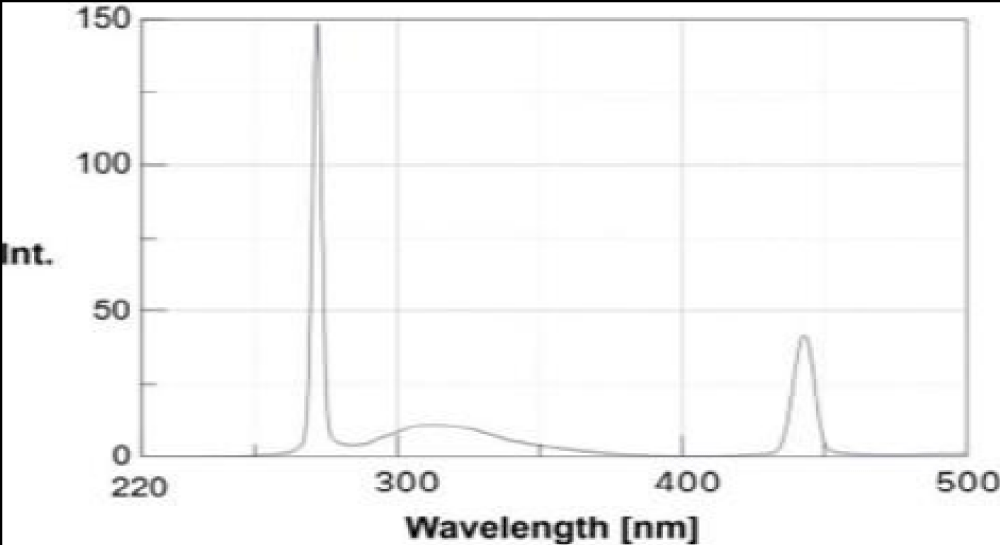
The UV spectrum of the GQD sample is shown in Figure 2.
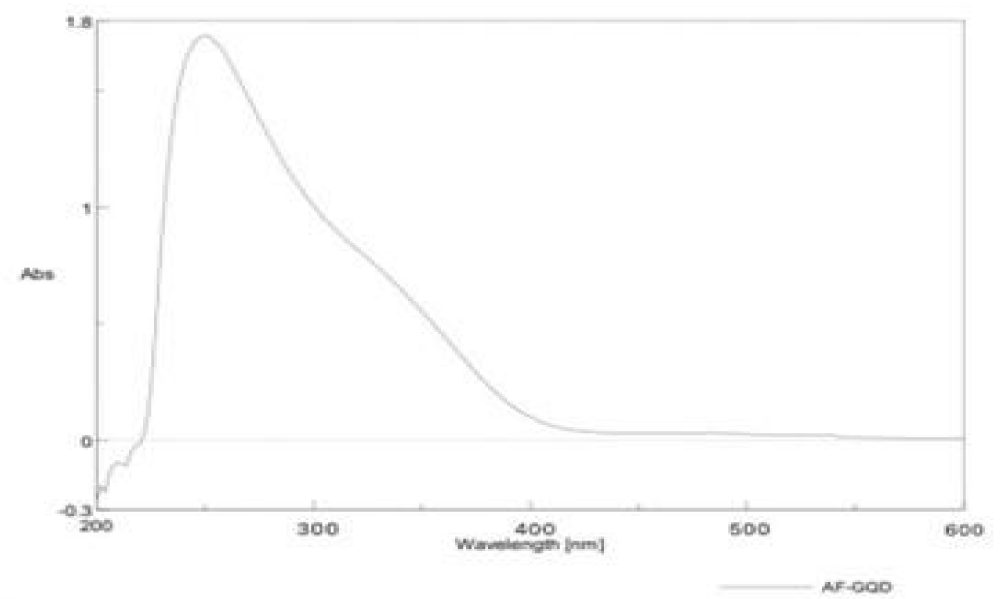
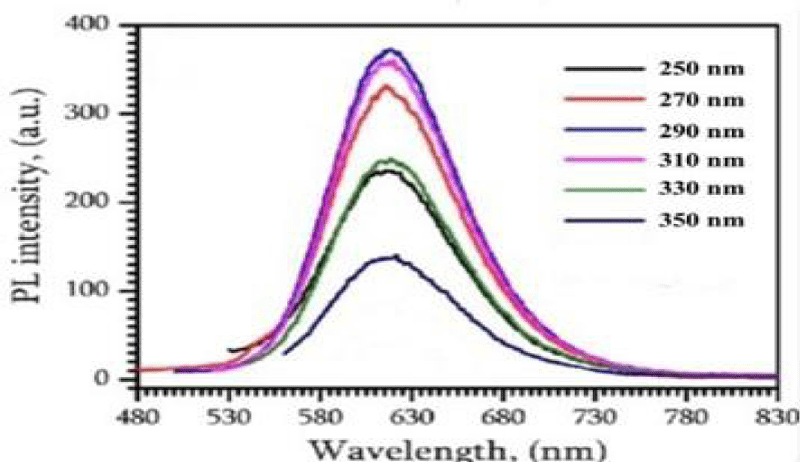
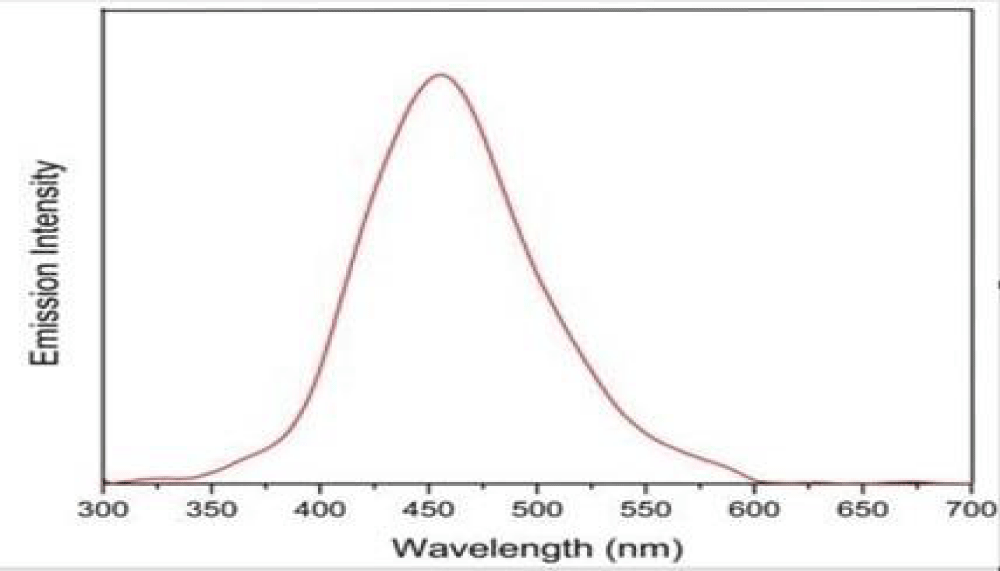
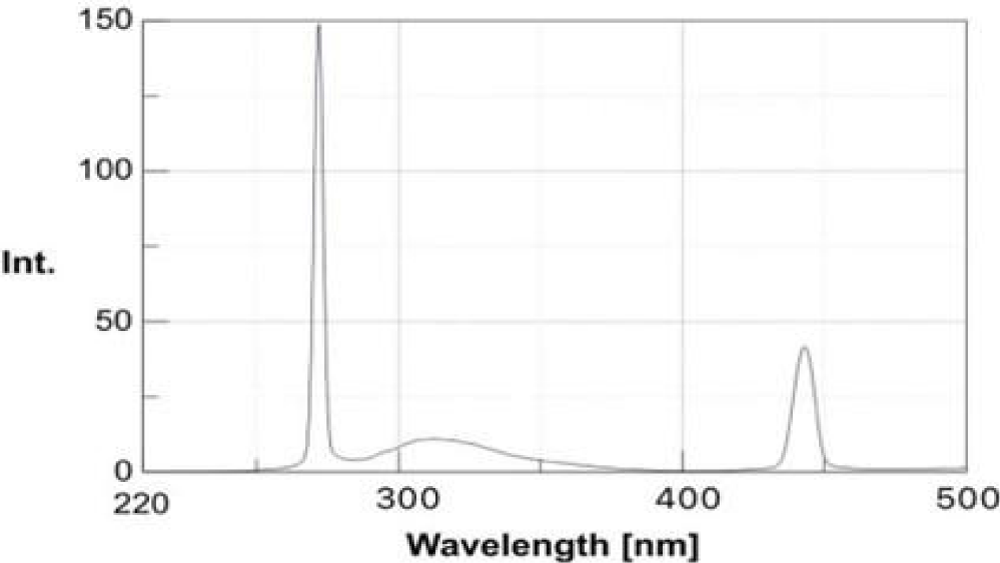
It shows the representative absorption band at 254 nm related to the n-1* (bonding-anti-bonding) transition of the sp2 aromatic domains. The GQDs also show excitation-dependent photoluminescence behaviour and a red shift was observed in the emissive wavelength when lower wavelength energy was used for the excitation of samples. This optical response is attributed to two types of energy states, intrinsic state formed by localised sp2 carbon subdomains and extrinsic state created by various oxygen functional groups. This might be due to the superoxide anion radical formed by dissolved oxygen in the presence of GQDs as a reducing agent which produces GQDs* The alkenes in GQDs can be oxidised by MnO4 in an acid medium to GQDs•*. The electron-transfer annihilation of GQDs•+ and GQDs could form excited-state GQDs*, which were relaxed by electron-hole recombination to produce CL which in turn produces green fluorescence. The GODs exhibited peaks at 264 nm shown in Figure 2 and another peak at 254 nm is shown in Figure 3. It is due to the π-π* transition of aromatic C=C bond and the peak at 254 nm assigned to the π-π* transition of C=0 bond respectively. The maximum PL emission at 440 nm for the prepared af-GQDs. When excited at 250-350 nm with increments of 20 nm, the GODS exhibit an excitation-dependent PL emission as shown in Figure 4. The PL peak wavelengths were shifted at different excitation wavelengths due to the different scales of the quantum confinement effects with different nanoparticle size. The PL emission peak should be attributed to the π-π* transition of the C-O bond of surface carboxylic groups.
Figure 2: Emission spectrum of Af-GQDs.
Figure 3: Absorption peak at 254 nm for Af-GQDs.
Figure 4: PL spectra of the aqueous solution of amine functionalized graphene quantum dot at an excitation wavelength of 250 nm -350 nm.
Quantum yield calculation
The quantum yield measurement is used to determine photo photo-emissive efficiency of GQDs. The quantum yield (Ф) of the GQDs was calculated using quinine sulfate as a reference in a UV- spectrofluorometer. Their fluorescence spectra were recorded at the same excitation of 350 nm and are shown in Figures 5,6 and values given in Table 3. By comparing the integrated photoluminescence intensities (at 350 nm) and the absorbance values (at 350 nm) of the sample with the reference quinine sulfate, the quantum yield of the GQD sample was determined. The quantum yield of the reference (Quinine sulphate) was taken as 0.54 and the refractive index was taken as 1.33. The quantum yield of formulated af-GQDs was found to be 26.32% [22].
Figure 5: Emission spectra of Quinine sulfate.
Figure 6: Emission spectra of af-GQDs.
| Table 3: Quantum Yield of af-GQDs. | ||||
| Concentration (μg/ml) | Absorbance of Quinine sulfate at 350 nm | Absorbance of af- GQDs at 350 nm | Quantum yield | % Yield |
| 2 | 0.1207 | 0.0123 | 0.2605 | 26.32% |
| 4 | 0.1805 | 0.0182 | 0.2865 | |
| 6 | 0.2895 | 0.0391 | 0.2725 | |
| 8 | 0.3724 | 0.0403 | 0.2759 | |
| 10 | 0.4751 | 0.0535 | 0.2404 | |
| 12 | 0.5981 | 0.0684 | 0.261 | |
| 14 | 0.6431 | 0.0757 | 0.2538 | |
| 16 | 0.7634 | 0.0793 | 0.2764 | |
| 18 | 0.823 | 0.0896 | 0.2745 | |
| 20 | 0.9558 | 0.1228 | 0.2312 | |
Particle size measurement
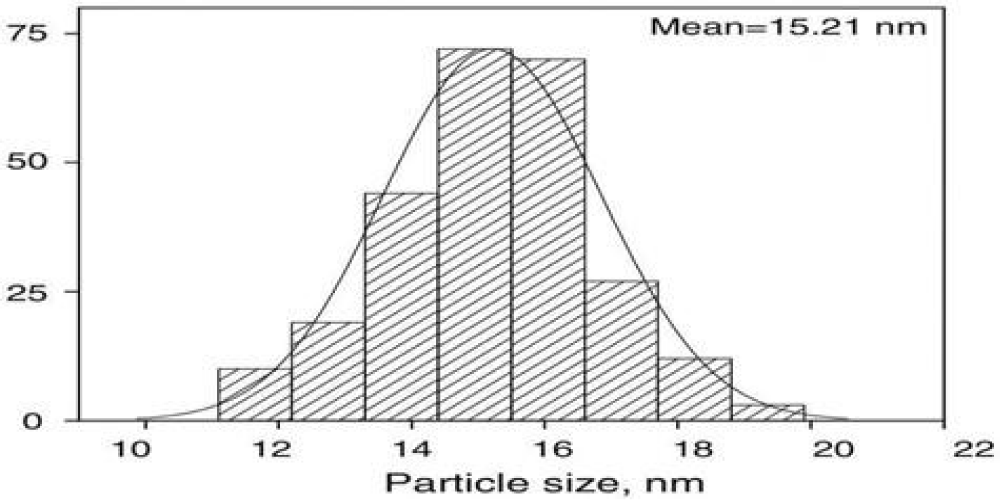
Particle size analysis showed that the average particle size of af-GQDs was found to be 15.21 nm for formulation F6 as shown in Figure 7 [23].
Figure 7: Particle size distribution of af-GQDs.
Zeta potential determination of the GQDs
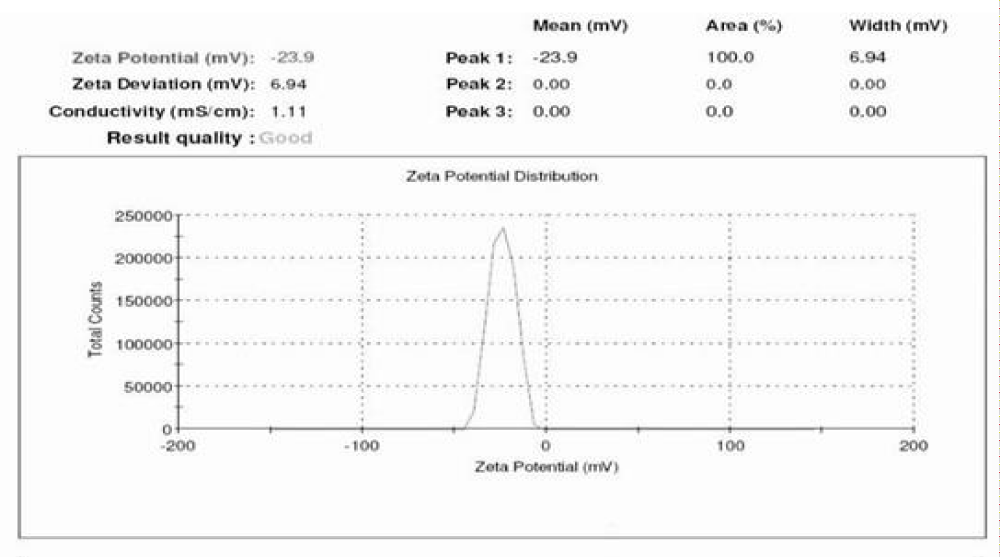
The zeta potential of synthesized GQDs was recorded by Malvern Zeta Sizer and is shown in Figure 8. Nanoparticles, endowed with zeta potentials values greater than +25 m V or more negative than - 25 m V, repel each other and show no tendency to aggregate, thus affording high stability in water. The zeta potential of synthesized GQDs was found to be -23.9 and high zeta potential confirms a high degree of carboxylic functional groups [24].
Figure 8: Zeta potential of af-GQDs.
Transmission electron microscopy (TEM)
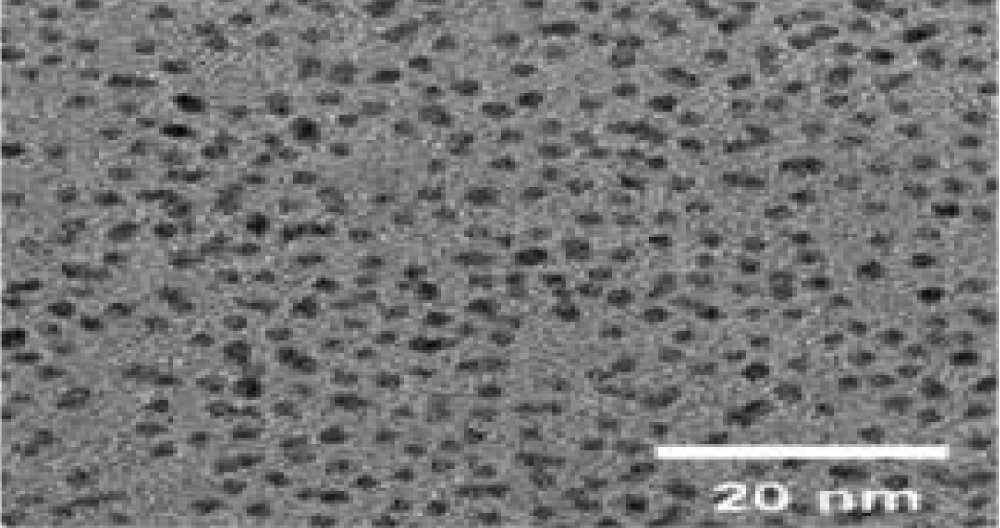
The representative TEM images of the synthesized quantum dots show mono-dispersed nanoparticles with circular shapes and uniform diameters less than 20 nm in size which indicates a crystalline graphene structure shown in Figure 9. The average particle size of the prepared GQDs was found to be 15.21 nm. The quantum size of the prepared af-GQDs is ideal for effective alternate antibacterial therapy [25].
Figure 9: TEM image of af-GQDs.
Fourier transform infrared (FTIR) spectral analysis
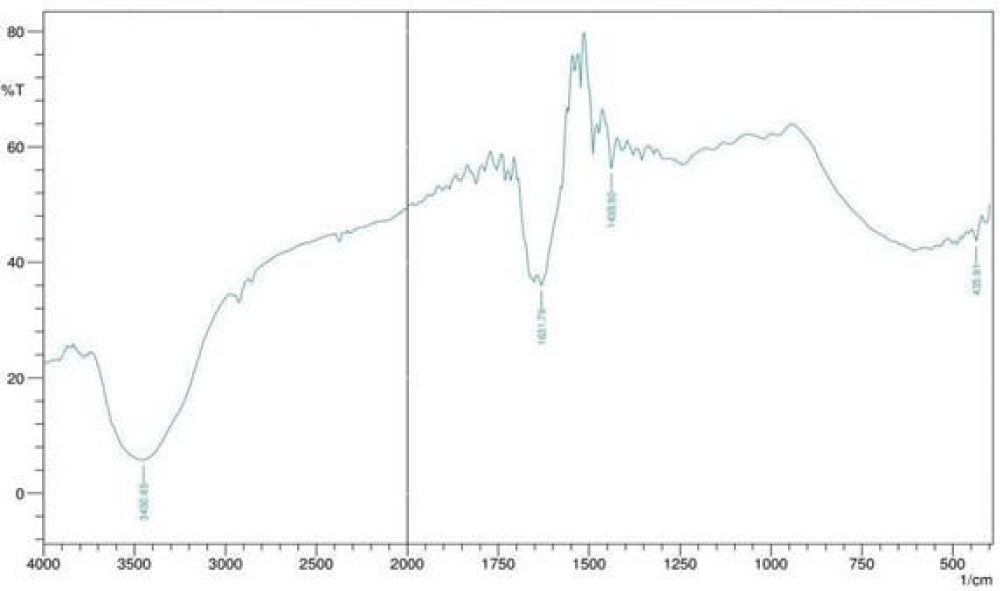
The spectrums recorded for the pure GQDs are shown in Figure 10.
Figure 10: FTIR spectrum of af-GQDs.
Table 4 presents the functional groups on prepared af-GQDs, the peak at 3450.65 show OH stretching also confirms the presence of carboxylic functional groups and successful amine functionalization. The peaks at 1631.78 and 1438.90 show the C=O stretching and asymmetric and symmetric stretching of C-O or C-N and -COO respectively [14].
Table 4: Interpretation of FTIR spectrum of af-GQDs. |
|||
| Materials | Standard wavenumber (cm-1) |
Test wavenumber (cm-1) | Functional group assignment |
| GQDs | 3650-3200 | 3450.65 | O-H stretching, NH and carboxylic acid groups |
| 1500-1680 | 1631.78 | C=O stretching | |
| 1000-1450 | 1438.90 | C-O or C-N and -COO asymmetric and symmetric stretching vibration |
|
Raman spectrum measurement
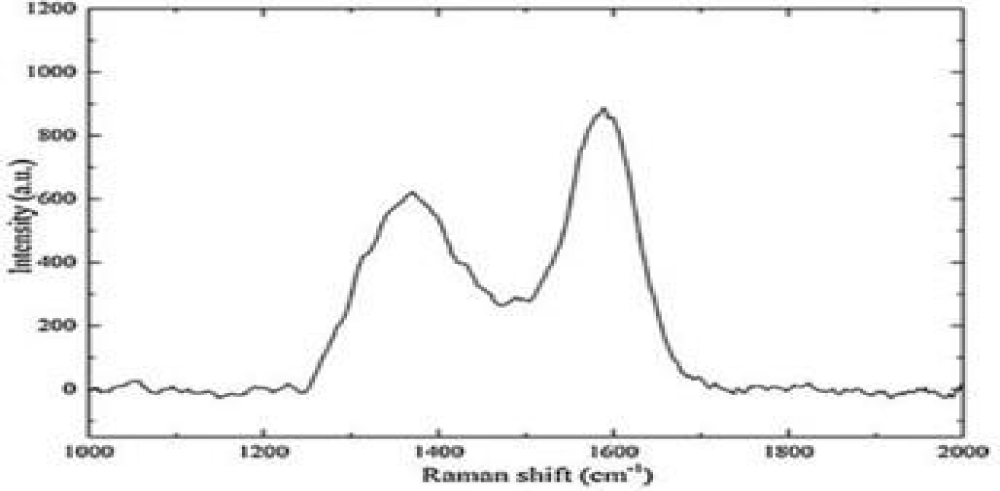
Raman spectroscopy was also employed to characterize and assess the quality of synthesized GQDs. Raman spectrum of prepared af-GQDs is shown in Figure 11. The D and G band features reveal important information about the successful formation of the desired quantum dots. The results indicate a G band of ordered sp2-bonded carbon and a D band of disordered carbon, respectively. Figure 11 shows the D-band at 1352 and G-band at 1594 which represent the Raman fingerprint of carbon nanostructures. The G band is associated with E2g vibrational modes of the sp2 carbon atom and the D band represents the edge defect and amorphous graphitic system. The intensity ratio ID/IG, disorder structure to the crystalline structure is used to express the extent of sp2 hybridization of carbon atoms and it was found to be 0.848. An increase in the ID/IG means an increase in the amount of topological disorder in the graphitic layer and a decrease in the size of nanocrystalline graphite. The ratio is close to 1, indicating that it is due to defective or disordered carbon [15].
Figure 11: Raman spectrum of af-GQDs.
Growth inhibition test
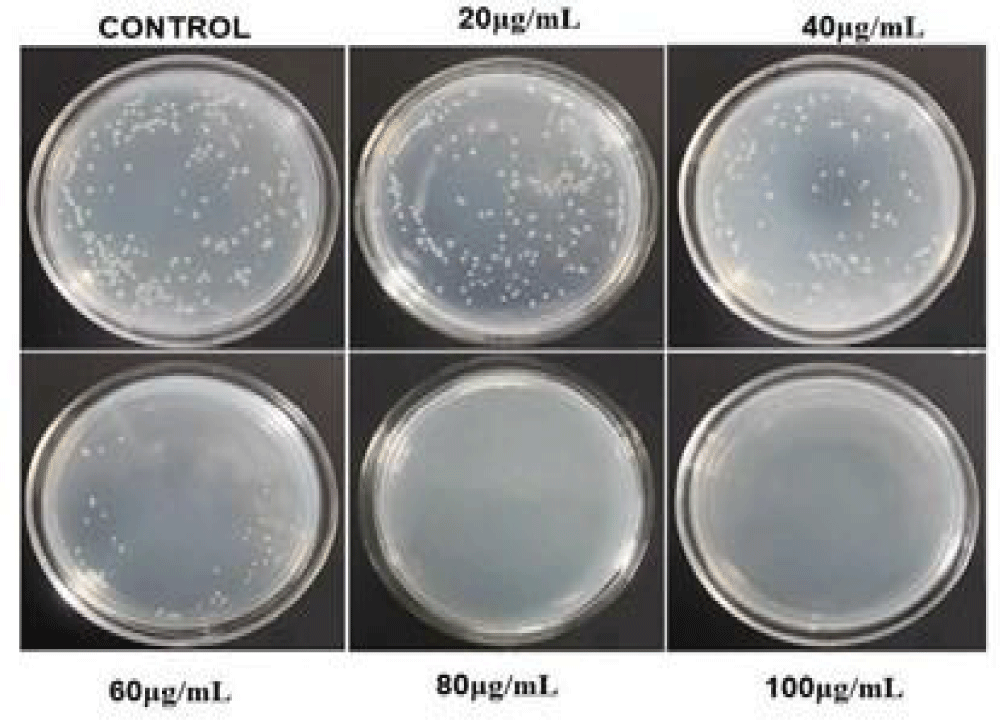
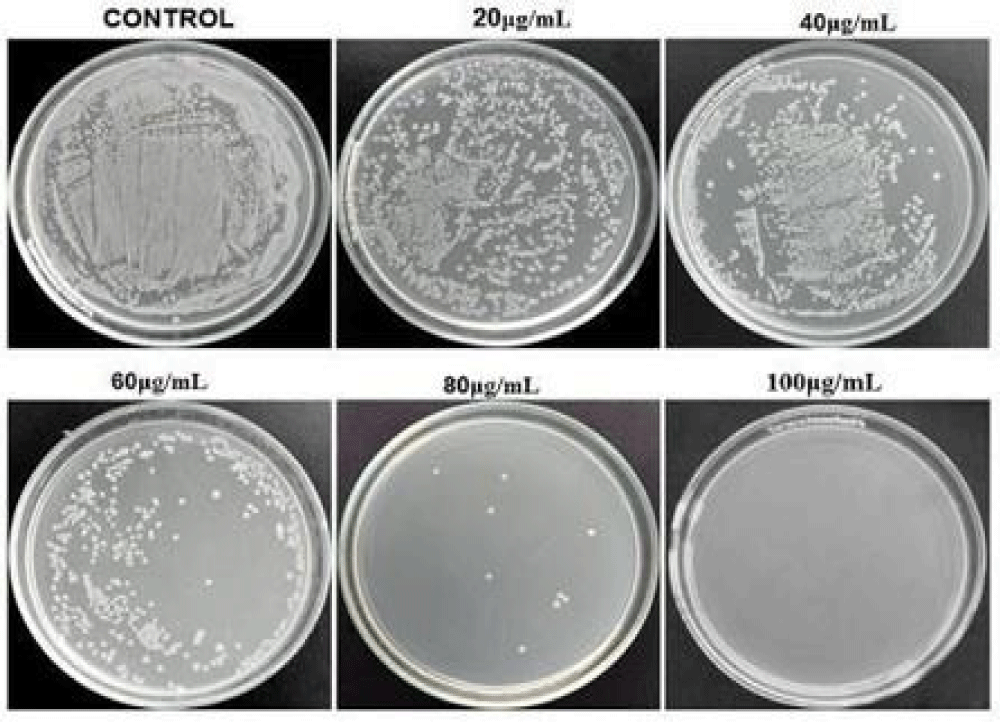
The inhibition of the growth of the microorganism where tested by the agar plate method at different concentrations of the af-GQDs. Figure 12 represents the inhibition of growth of E. coli at different concentrations of af-GQDs, at the lowest concentration the growth is not inhibited, at the concentration of 40μg/mL the growth inhibition is started and there will be complete inhibition of growth at a maximum concentration of 100μg/mL. Figure 13 represents the inhibition of the growth of S. aureus at different concentrations of af-GQDs, at the lowest concentration the growth is not inhibited, the inhibition of the organism started at the concentration of 40μg/mL and there will be complete inhibition of growth at a maximum concentration of 100μg/ml [26].
Figure 12: Growth inhibition test on E. coli at different concentrations of af-GQDs.
Figure 13: Growth inhibition test on S. aureus at different concentrations of af-GQDs.
Microdilution method
Minimum Inhibitory Concentration (MIC) is the lowest concentration of af-GQDs to inhibit the visible growth of a bacteria species. The af-GQDs solution was prepared in vitro at various concentrations with separated batches. The same amount of target bacteria species was incubated with the batches for more than 10 hours. Optical transparency for the batch solution indicates the inhibitory ability of the af-GQDs to the bacteria. Table 5 represents Minimum Inhibitory Concentration of af-GQDs on E. coli and S. aureus. The MIC for E. coli was found to be 55 μg/mL and S. aureus was found to be 35 μg/mL. The required concentration of af-GQDs for antibacterial activity was less for S. aureus compared to E. coli [16].
Table 5: MIC of af-GQDs on E. coli and S. aureus. |
|
| Microorganisms | MIC (μg/mL) |
| E. coli | 55 |
| S. aureus | 35 |
MTS cell viability test
Cell viability assays were assessed in Jurkat and HeLa cells for Amine functionalized GQDs at the concentrations (25, 50, 100, and 150 g/mL) using the (MTS) CellTiter 96® Aqueous Solution Cell proliferation Assay. For HeLa, 2×10⁴ cells were seeded in 96-well plates and for Jurkat 2×10⁵ cells were seeded in 96-well plates and grown overnight. Fresh culture medium was used as a negative control. After 24 h of cell incubation, the medium was discarded and 100 L of fresh cell medium with 20 L of MTS reagent was added. Then, the cells were incubated for 30 min at 37◦ C and centrifuged at 1400 rpm for 5 min. Subsequently, the cell medium containing the MTS reagent was transferred to a new microplate, and the absorbance at 490 nm was measured with a UV–vis microplate spectrometer. For data analysis, the results were expressed as % of cell viability. The equation used was the following [17]:
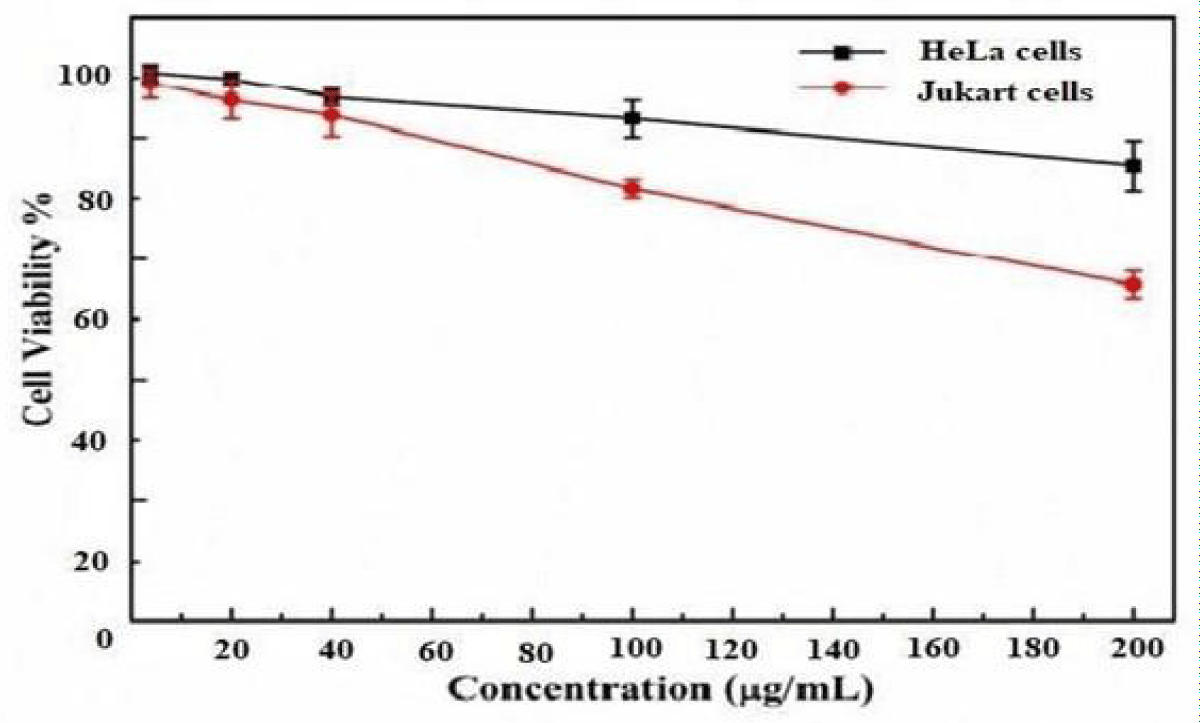
Figure 14 represents the percentage of viability of HeLa and Jukart cell models at different concentrations of af-GQDs. In HeLa cell models at a lower concentration of 20 μg/mL, the viability of the cells was found to be 100% but, at the higher concentration of 200 μg/mL, the percentage of cell viability was 88% respectively. For, Jukart cell models the percentage of cell viability at a lower concentration 20 μg/mL was found to be 98% and at the higher concentration 200 μg/mL the percentage viability is 65% respectively. From the results, it was found that the prepared af- GQDs show better cell viability in HeLa cell models than in the Jukart cells.
Figure 14: % cell viability of HeLa and Jukart cells at different concentrations of af-GQDs.
The need for antibiotic alternatives has attracted substantial research interest in the past several years. To minimize the risk of drug abuse and drug resistance nanotechnology is one of the major antibiotic alternatives for effective treatment against bacterial infections. However, conventional therapy using solo antibiotic drugs suffers from several limitations, such as low water solubility, poor bioavailability, nonspecific selectivity, low local therapeutic concentration as well as adverse side effects to normal cells. Graphene quantum dots (GQDs), a new kind of nanomaterial with the combined properties of graphene and QDs are considered a natural candidate for an effective anti-biotic alternative. The high specific surface area and biocompatibility endow their capability to act against microorganisms with lower toxicity. Also, due to the Photoluminescence property of GQDs, the delivery complex can be observed without further modifying them with other marker dyes. Graphene oxide (GO) and its derivatives have also shown considerable potential in biological applications, including molecular imaging, drug delivery, and photothermal therapy due to their hydrophilicity and biocompatibility. GO exhibits an excellent loading capacity for highly aromatic molecules via strong n- n stacking interactions, which have been employed to deliver various types of water-insoluble drugs into cells.
- Kadian S, Manik G, Das N, Nehra P, Chauhan RP, Roy P. Synthesis, characterization and investigation of synergistic antibacterial activity and cell viability of silver-sulphur doped graphene quantum dots (Ag@S-GQDs) nanocomposite. J Mater Chem B. 2020;8:3028-3037. Available from: https://pubs.rsc.org/en/content/articlehtml/2020/tb/c9tb02823d
- Nichols F, Chen S. Graphene oxide quantum dot-based functional nanomaterials for effective antimicrobial applications. Chem Rec. 2020;20:1505-1515. Available from: https://doi.org/10.1002/tcr.202000090
- Rajendiran K, Zhao Z, Pei DS, Fu A. Antimicrobial activity and mechanism of functionalized quantum dots. Polymers. 2019;11(10):1670. Available from: https://doi.org/10.3390/polym11101670
- Wong KK. Synthesis of nitrogen-doped graphene quantum dots and its antibacterial property. Pal Yue-Kong Library: 2018;59. Available from: https://theses.lib.polyu.edu.hk/handle/200/9414
- Cheng L, Huang S, Wang X. Surface modification of graphene quantum dots and their biocompatibility in biomedical applications. Carbon. 2018;138:88-98..
- Habiba K, Bracho-Rincon DP, Gonzalez-Feliciano JA, Villalobos-Santos JC, Makarov VI, Ortiz D, et al. Synergistic antibacterial activity of PEGylated silver-graphene quantum dot nanocomposites. Appl Mater Today. 2015;80-87. Available from: https://doi.org/10.1016/j.apmt.2015.10.001
- Yang J, Zhang X, Ma YH, Gao G, Chen X, Jia HR, et al. Carbon dot-based platform for simultaneous bacterial distinguishment and antibacterial applications. ACS Appl Mater Interfaces. 2016;8(47):32170-32181. Available from: https://doi.org/10.1021/acsami.6b10398
- Chen S, Quan Y, Yu YL, Wang JH. Graphene quantum dot/silver nanoparticle hybrids with oxidase activities for antibacterial application. ACS Biomater Sci Eng. 2017;3(3):313-321. Available from: https://doi.org/10.1021/acsbiomaterials.6b00644
- Chhabra VA, Kaur R, Kumar N, Deep A, Rajesh C, Kim KH. Synthesis and spectroscopic studies of functionalized graphene quantum dots with diverse fluorescence characteristics. RSC Adv. 2018;8:11446-11454. Available from: https://doi.org/10.1039/C8RA01148F
- Wang Z, Xia J, Zhou C, Via B, Xia Y, Zhang F, et al. Synthesis of strongly green-photoluminescent graphene quantum dots for drug carrier. Colloids Surf B Biointerfaces. 2013;112:192-196. Available from: https://doi.org/10.1016/j.colsurfb.2013.07.025
- Iannazzo D, Pistone A, Ferro S, De Luca L, Monforte AM, Romeo R, Buemi MR, Pannecouque C, et al. Graphene quantum dots-based systems as HIV inhibitors. Bioconjug Chem. 2018;29(9):3084-3093. Available from: https://doi.org/10.1021/acs.bioconjchem.8b00448
- Zhao M. Direct synthesis of graphene quantum dots with different fluorescence properties by oxidation of graphene oxide using nitric acid. Appl Sci. 2018;8(8):1303. Available from: https://doi.org/10.3390/app8081303
- Tuerhong M, Yang X, Yin X-B. Review on carbon dots and their applications. Chin J Anal Chem. 2017;45(1):139-150. Available from: http://dx.doi.org/10.11895/j.issn.0253-3820.160295
- Arias LR, Yang LJ. Inactivation of bacterial pathogens by carbon nanotubes in suspensions. Langmuir. 2009;25(5):3003-3012. Available from: https://doi.org/10.1021/la802769m
- Liang J, Li W, Chen J, Huang X, Liu Y, Zhang X, et al. Antibacterial activity and synergetic mechanism of carbon dots against Gram-positive and -negative bacteria. ACS Appl Bio Mater. 2021;4(9):6937-6945. Available from: https://doi.org/10.1021/acsabm.1c00618
- Gao W, Thamphiwatana S, Angsantikul P, Zhang L. Nanoparticle approaches against bacterial infections. Wiley Interdiscip Rev Nanomed Nanobiotechnol. 2014;6(6):532-547. Available from: https://doi.org/10.1002/wnan.1282
- Zhu Z, Bai Q, Li S, Li S, Liu M, Du F, et al. Antibacterial activity of graphene and graphene oxide. Small. 2020;16:2001440. Available from: https://doi.org/10.1002/smll.202001440
- Meziani MJ, Dong X, Zhu L, Jones LP, LeCroy GE, Yang F, et al. Visible-light-activated bactericidal functions of carbon "quantum" dots. ACS Appl Mater Interfaces. 2016;8(17):10761-10766. Available from: https://doi.org/10.1021/acsami.6b01765
- Sun B, Wu F, Zhang Q, Chu X, Wang Z, Huang X, et al. Insight into the effect of particle size distribution differences on the antibacterial activity of carbon dots. J Colloid Interface Sci. 2021;584:505-519. Available from: https://doi.org/10.1016/j.jcis.2020.10.015
- Xin Q, Shah H, Nawaz A, Xie W, Akram MZ, Batool A, et al. Antibacterial carbon-based nanomaterials. Adv Mater. 2019;31(45):e1804838. Available from: https://doi.org/10.1002/adma.201804838
- Dong X, Liang W, Meziani MJ, Sun YP, Yang L. Carbon dots as potent antimicrobial agents. Theranostics. 2020;10(2):671-686. Available from: https://doi.org/10.7150/thno.39863
- Sun J, Yang S, Wang Z, Shen H, Xu T, Sun L, et al. Ultra-high quantum yield of graphene quantum dots: aromatic-nitrogen doping and photoluminescence mechanism. Particle & Particle Systems Characterization. 2015;32(4):434-430. Available from: http://www.seu-npc.com/publications/2015-Part.%20Part.%20Syst.%20Charact-Jing%20Sun.pdf
- Allen T. Particle size measurement. Springer; 2013 Nov 21. Available from: https://books.google.co.in/books/about/Particle_size_measurement.html?id=7dsFCAAAQBAJ&redir_esc=y
- Clogston JD, Patri AK. Zeta potential measurement. In: Characterization of nanoparticles intended for drug delivery. 2011:63-70. Available from: https://doi.org/10.1007/978-1-60327-198-1_6
- Tang CY, Yang Z. Transmission electron microscopy (TEM). In: Membrane characterization. Elsevier; 2017:145-159. Available from: http://dx.doi.org/10.1016/B978-0-444-63776-5.00008-5
- Kuo WS, Shao YT, Huang KS, Chou TM, Yang CH. Antimicrobial amino-functionalized nitrogen-doped graphene quantum dots for eliminating multidrug-resistant species in dual-modality photodynamic therapy and bioimaging under two-photon excitation. ACS Appl Mater Interfaces. 2018;10:14438-14446. Available from: https://doi.org/10.1021/acsami.8b01429
